The Big Five model is probably the most influential theory of personality in psychology. However, other researchers criticized the model for the lack of theoretical underpinnings, for being too simplistic or explaining too little variance (e.g., refer to Block, 2010 for a critique).
The latest critical comments were added from Ludeke and Larsen (2017) who wrote a paper that will be published in the Journal “Personality and Individual Differences” in July (it’s already available online). Ludeke and Larsen analyzed a large dataset of the World Values Survey (WVS), which for the first time included ten questions from the Big Five Inventory. They discovered that performance of this questionnaire might not be satisfactory outside of WEIRD countries (Western, Educated, Industrialized, Rich, and Democratic). They could show that individual items that should measure the same personality trait did not correlate or even correlated negatively in most countries. This challenges the reliability of the questionnaire and potentially even the applicability of the Big Five model in non-WEIRD cultures.
I took a closer look at the figures they presented in the paper and was surprised that the World Values Survey data had an extreme outlier – Bahrain. For respondents in this country, agreement on statements such as “I see myself as someone who tends to be lazy” and “I see myself as someone who does a thorough job” were very highly negatively correlated (after recoding - of course). How could that be possible? I decided to download the dataset myself; it is publicly available at the WVS.
I ran some of my pre-existing code for a quick and dirty “long-string analysis” (refer to Curran, 2016 for a more detailed explanation of the procedure). The idea behind a long-string analysis stems from research on carelessness in online surveys: The longer an individual participant selected the same answer in a row, the more likely they were not attentive. Especially, when - as in this case - reversed questionnaire items are present. I decided to be rather conservative with this measure and looked only at people who gave the same answer 10 times in a row. This means that they gave the same answer to all 10 BFI items, although 5 items of this scale are reversed.
The analysis showed that almost 64% of the Bahrain sample fell into that category. For South Africa and Singapore, the relative frequency of this answer pattern was also quite large (>5%). These patterns and their frequency seem a bit peculiar, especially because the data were collected with face-to-face interviews. I’ve decided to remove those observations and re-run the correlational analysis by Ludeke & Larsen (with the code they provided in the supplementary materials of the paper).
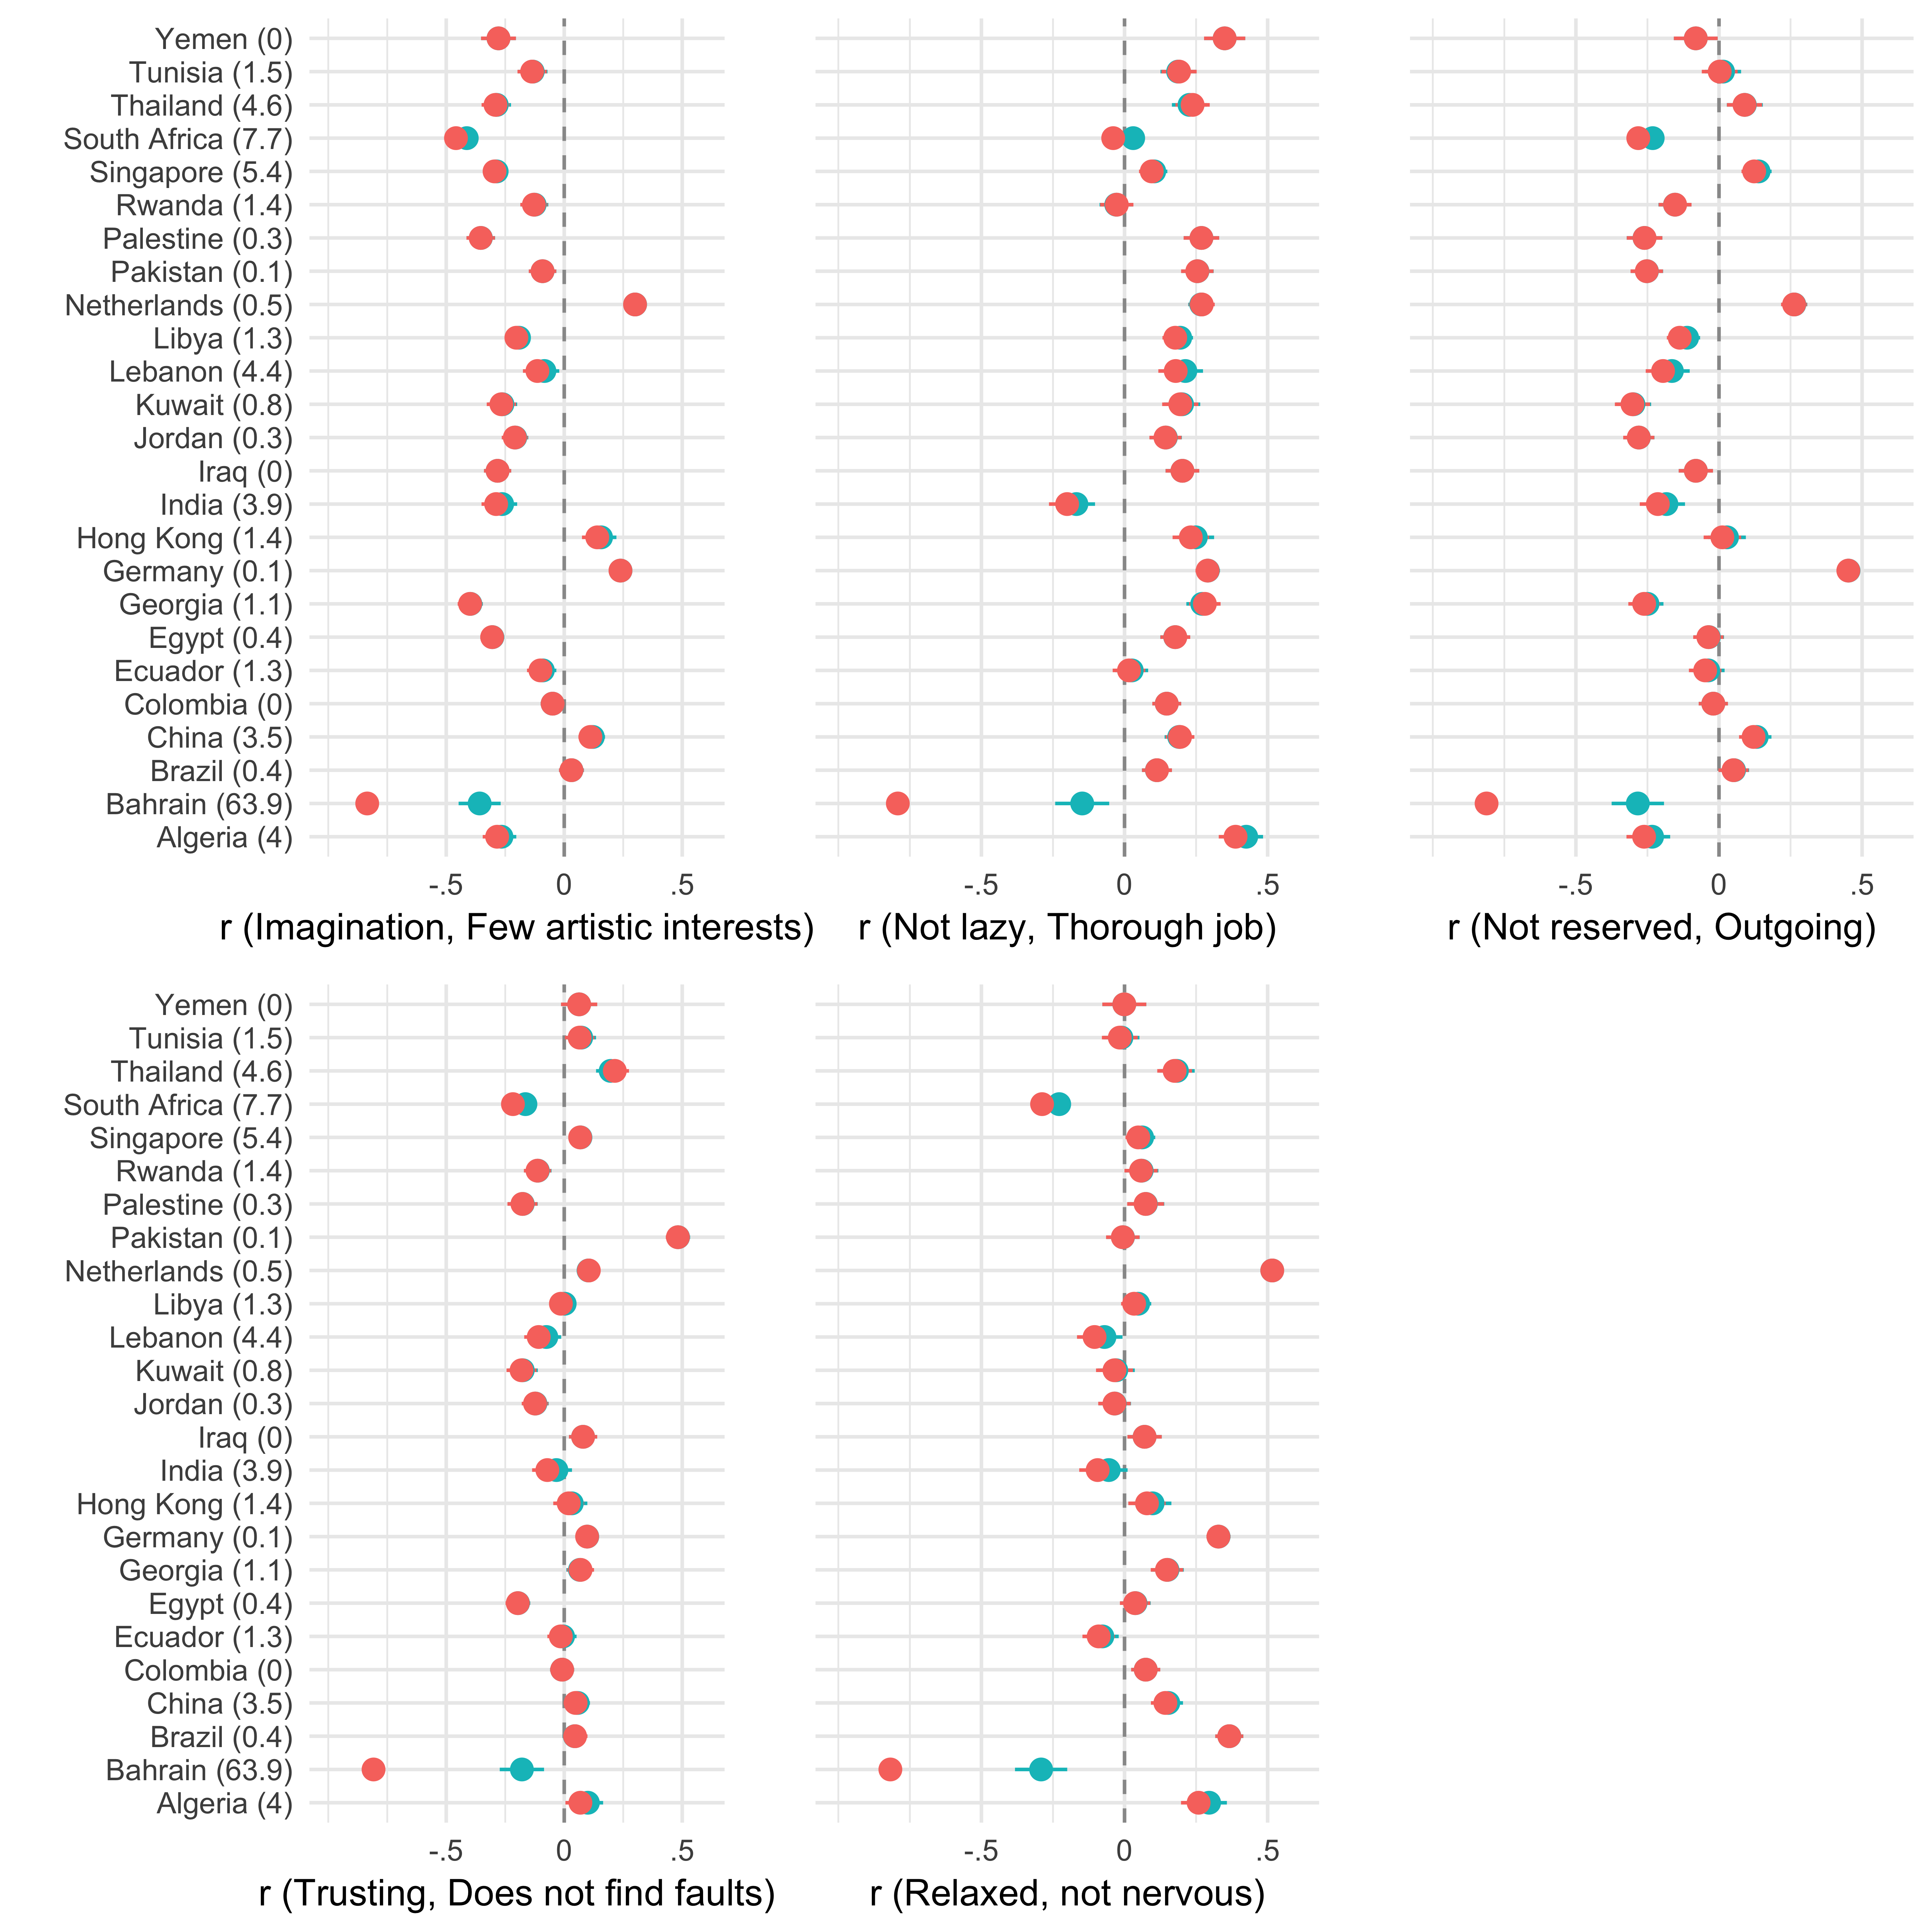 Figure with a comparison of the original data (red) to the cleaned data set (turquoise). The numbers behind the countries indicate how often participants in this sample provided the same answers to all 10 BFI items.
After the removal of these observations, the correlations for the Bahrain sample are in a range comparable to other non-WEIRD countries. However, is this dataset really trustworthy? I am not sure. At least the Bahrain data appears to be seriously flawed. It seems very unlikely that more than 60 percent of the people interviewed gave the same answer on all items of the Big Five Inventory. Checking the whole dataset with other methods may be useful. For example, outlier analysis (Mahalanobis distance), a more strict long-string analysis (e.g., remove participants with six or more identical answers in a row) or a more rigorous analysis including other questions of the WVS dataset.
Ludeke and Larsen briefly discussed a few possible explanations for the negative correlations: There may have been coding errors or even country specific errors. However, they did find positive correlations between the two items for conscientiousness for most countries. After removing data that is implausible, the correlations are still below zero or close to zero, and the concerns raised of Ludeke & Larsen (2017) are still valid.
I believe that this shows quite well that even today, in a world where extensive data is effortlessly available, it is important not to trust data without a proper examination. In my research as a Ph.D. student at the HCI research group, one of my goals is to compare and improve measures of data quality in (online) surveys to give researchers and practitioners better tools to make informed decisions about removing or including suspicious respondents.
Update: Rene Bekkers wrote a compelling blog post about the same topic.
References
Block, J. (2010). The five-factor framing of personality and beyond: Some ruminations. Psychological Inquiry, 21(1), 2-25.
Curran, P. G. (2016). Methods for the detection of carelessly invalid responses in survey data. Journal of Experimental Social Psychology, 66, 4-19.
Ludeke, S. G., & Larsen, E. G. (2017). Problems with the Big Five assessment in the World Values Survey. Personality and Individual Differences, 112, 103-105.